
We want not just jobs, but meaningful employment that offers fair pay, growth opportunities, and recognizes our skills and experience.
Welcome to the NEWcomer
Project Community Map!
The data used to create this map was gathered from January 2026-April
2026. This map shows the organizations and services around the North East Wisconsin Region
which support immigrants and refugees as they resettle in the area.
Each sector shows what is available and reflects the perspectives of
Newcomers as well as organizations.
A "Newcomer" is a person or family who has moved to the region or
the United States in the past 5-10 years and is learning and adjusting
to the main languages and cultures of our region.
To learn more about this project, please visit
Hope & Help Together's project webpage
.
Sectors
 Basic Needs
 Education
 Employment
 Finance
 Healthcare
 Housing
 Language and Literacy
 Legal
Legal
 Recreation
 Religion and Faith
 Transportation
On this Page
Newcomer Perspective
of the Employment Sector
Map of Organizations
in the Employment Sector
Employment Sector Analysis
29% of organizations that responded provide employment services.
Please note: Not all respondents answered every question. As a result, the number of responses varies by question.
Newcomer Employment Background
Are college-educated household members working in their field?
Yes
No
Some Yes, Some No
Do you know how to use international credentials in the regional job market?
Yes
No
Career Background
Business, Finance, Accounting, HR & Administration
Healthcare
Education, Training & Social Services
Engineering, Manufacturing & Skilled Trades
Law, Labor Rights & Public Safety
Arts, Design, Media & Culture
Hospitality, Tourism & Food Service
Other
Religion & Theology
Technology & Computing
Current Careers
Manufacturing, Factory & Industrial Work
General / Unspecified Work
Retail / Food Service / Hospitality
Construction / Skilled Labor
Education / Students / English Classes
Not Working / Unemployed / Unsure / Retired
Home Care / Caregiving
Homemaker / Stay-at-Home Caregiver
Cleaning / Commercial Cleaning
Multiple Jobs in Household
Positive Employment Experiences
Case Management / Professional Services
Healthcare / Emergency Services
Beauty Services
Self-Employment / Business Ownership
Social / Communication Difficulties
Future Career Goals
Education / Language Learning / Credential Completion
Career Advancement / Field-Aligned Job
General / Unspecified Employment
Healthcare Careers
Unsure / Undecided
Entrepreneurship / Business Ownership
Family Stability & Well-Being
Housing / Financial Stability
Cleaning Business
Past Work Experience
Retirement
Return to Home Country
Teaching
Travel / Personal Goals
International Credential Recognition
Workforce Participation
Employment responses reflected both successful workforce participation and barriers to obtaining quality employment.
About 26% of responses (19 of 73) described positive employment experiences, including stable jobs, fair pay, full-time work, and employment aligned with skills or experience.
Job Seeking and Career Advancement
18% of responses (13 of 73) came from individuals who were unemployed or actively seeking work.
Another 16% (12 of 73) focused on the need for better-paying jobs, career advancement opportunities, or employment in a respondent’s trained profession.
Additionally, 10% of responses (7 of 73) called for more job opportunities and easier pathways into employment.
Employment Barriers and Supports
Respondents identified barriers related to language (7%, 5 of 73) and documentation or Social Security requirements (5%, 4 of 73), which can limit access to employment.
Several respondents expressed a need for employment resources, licensing support, flexible schedules, childcare, and improved workplace conditions.
Employment Services requested, offered, or planned
0%
10%
20%
30%
40%
50%
Career-Related Education & Training
Employment Placement
Farming Opportunities
Job Skills Training
Workplace Classes
Percent of organizations offering the service
Percent of organizations planning to offer the service
Percent of Newcomer respondents who requested the service
Newcomer Journey
for the Employment Sector
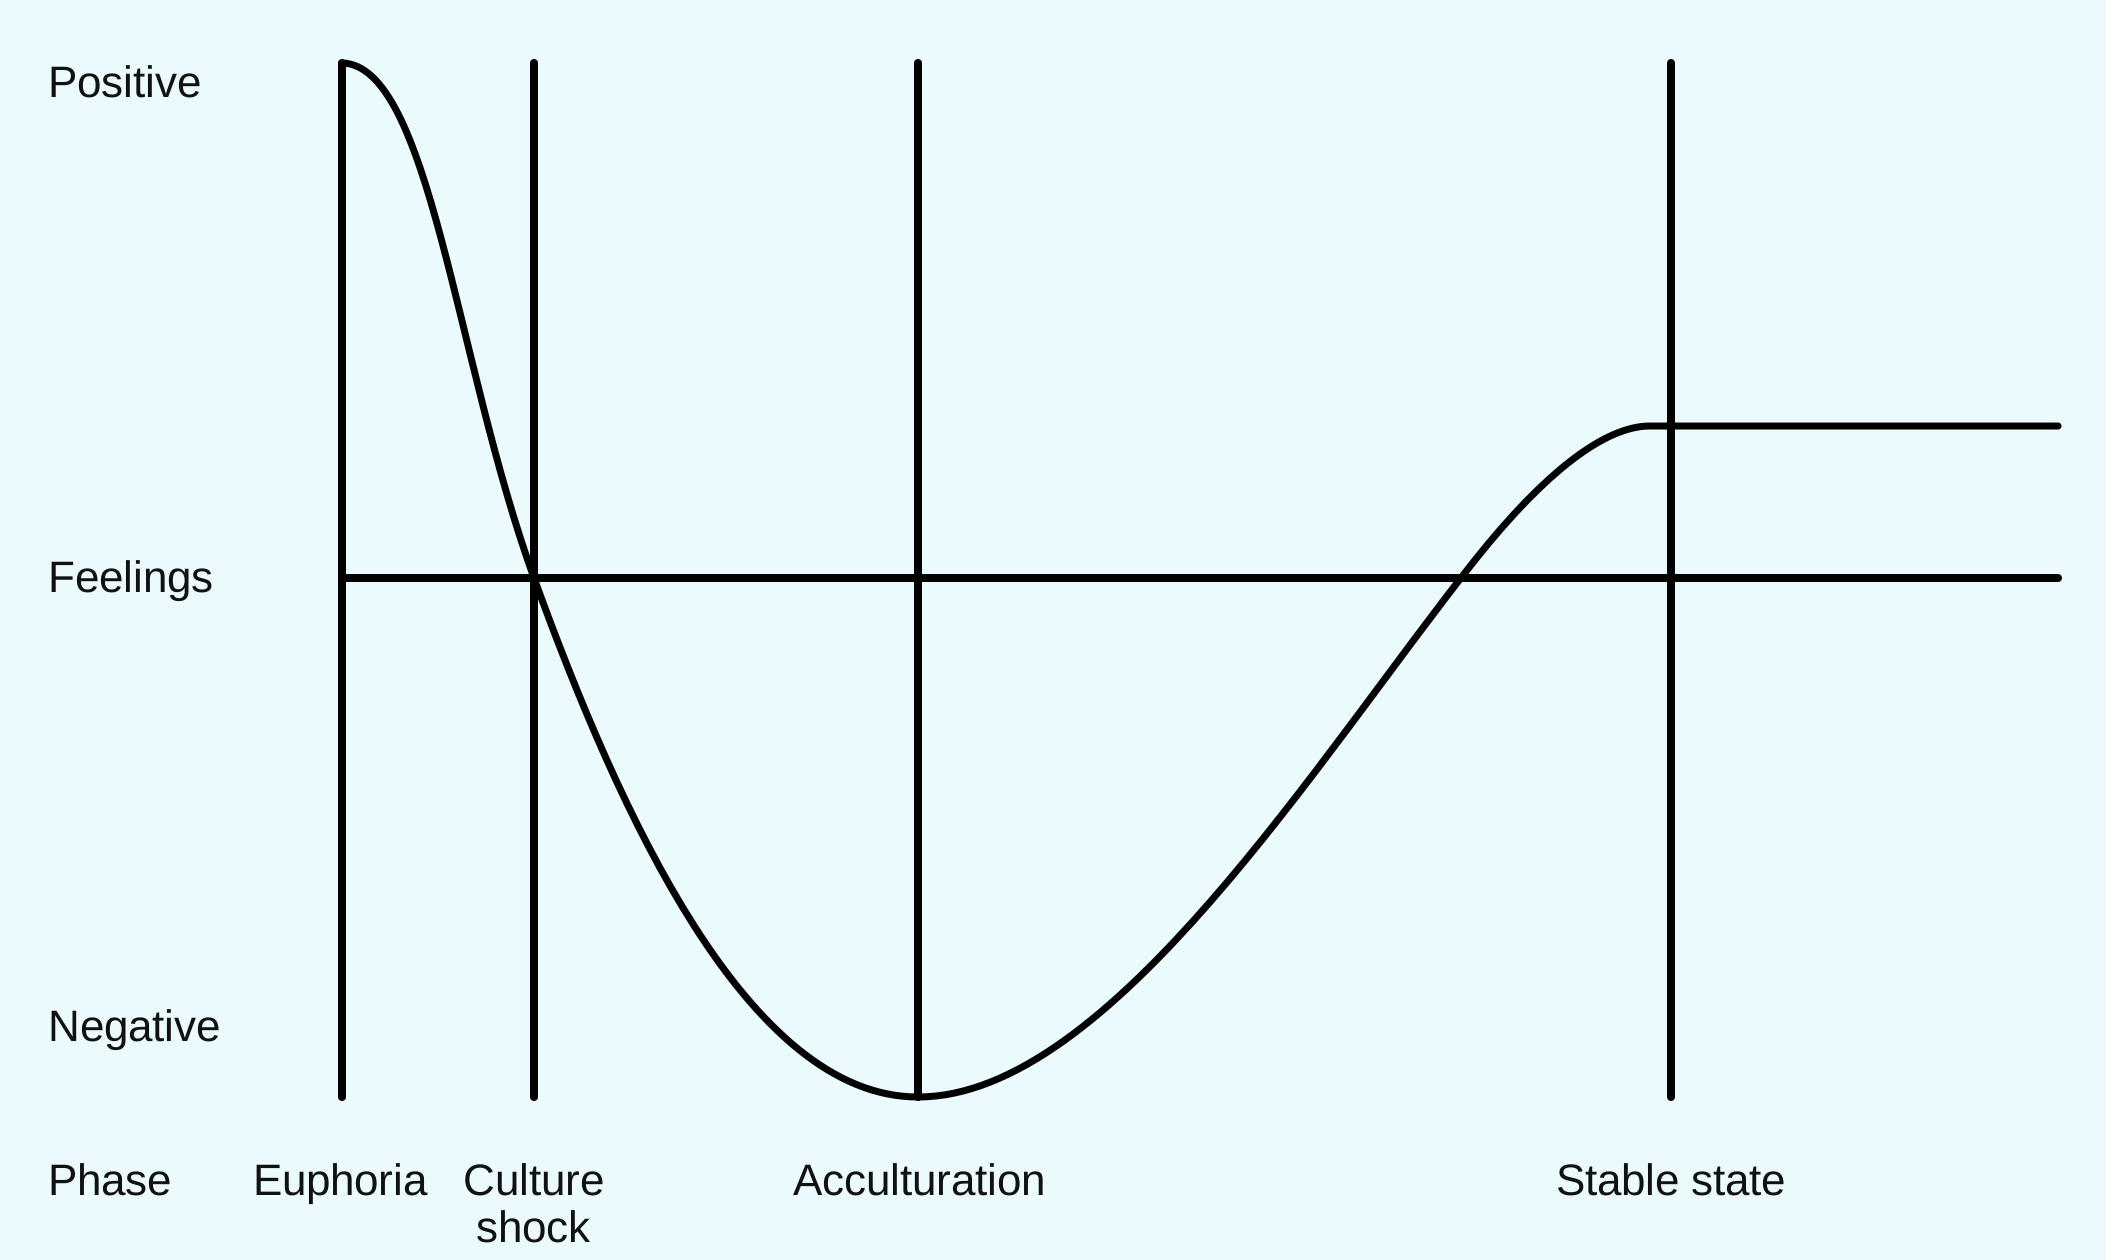
Newcomers are all at different stages in this timeline depending on when they arrived in the US.
The organizations included in survey data may focus on one, more or all areas of the acculturation curve in the effort to help Newcomers thrive. Below the chart you will see the acculturation curve focus point(s) of the organizations included.
The Acculturation Curve adjusting to a new life
Euphoria - first couple weeks or month after resettlement
Culture shock - begins about 6 weeks after resettlement
Acculturation - usually takes 2-10 years depending on the age and life events of an individual
Stable stage - state of arrival
Euphoria
- Appleton Area School District
- Appleton Public Library
- Forward Service Corporation
- Fox Valley Literacy
Culture Shock
- Appleton Area School District
- Appleton Public Library
- Forward Service Corporation
- Fox Valley Literacy
- VPI, Inc.
Acculturation
- Appleton Area School District
- Appleton Public Library
- Forward Service Corporation
- Fox Valley Church, Kimberly, WI
- Fox Valley Literacy
- VPI, Inc.
Stable State
- Appleton Area School District
- Appleton Public Library
- Forward Service Corporation
- Fox Valley Literacy
- VPI, Inc.